Telemetry
Exograph includes support for console logging as well as OpenTelemetry to collect and export telemetry data.
Console logging
Exograph enables console logging by default and sets its level to "info". You may control the output by setting the EXO_LOG environment variable. For example, setting EXO_LOG=trace will enable very verbose "trace" level logging.
The log level can also be varied for different libraries used to build the server. For example, EXO_LOG=debug,h2=warn will enable debug level logging but disable the verbose output from the Rust h2 library which is mostly low-level network protocol information.
Underneath the hood, Exograph uses the tracing library, which provides a rich set of options for controlling the output. The EXO_LOG environment variable behaves identically to the RUST_LOG variable in the tracing library.
Please see the EnvFilter documentation to tune the output for specific crates and modules.
OpenTelemetry
OpenTelemetry support is built in to the exograph server and can be enabled simply by setting the EXO_ENABLE_OTEL environment variable to true.
You can also set standard environment variables to configure the exporter. A subset of these are supported, including:
OTEL_SERVICE_NAMEto set the name of your service.OTEL_EXPORTER_OTLP_ENDPOINTto set the endpoint to export trace data to.OTEL_EXPORTER_OTLP_PROTOCOLthe OTLP version used. Can begrpc(the default) orhttp/protobuf.OTEL_EXPORTER_OTLP_HEADERSallows you to set custom headers such as authentication tokens.
For example, to export data to Honeycomb, you can set the variables:
OTEL_SERVICE_NAME=my_exo_server
OTEL_EXPORTER_OTLP_ENDPOINT=https://api.honeycomb.io:443
OTEL_EXPORTER_OTLP_HEADERS="x-honeycomb-team=your-api-key"
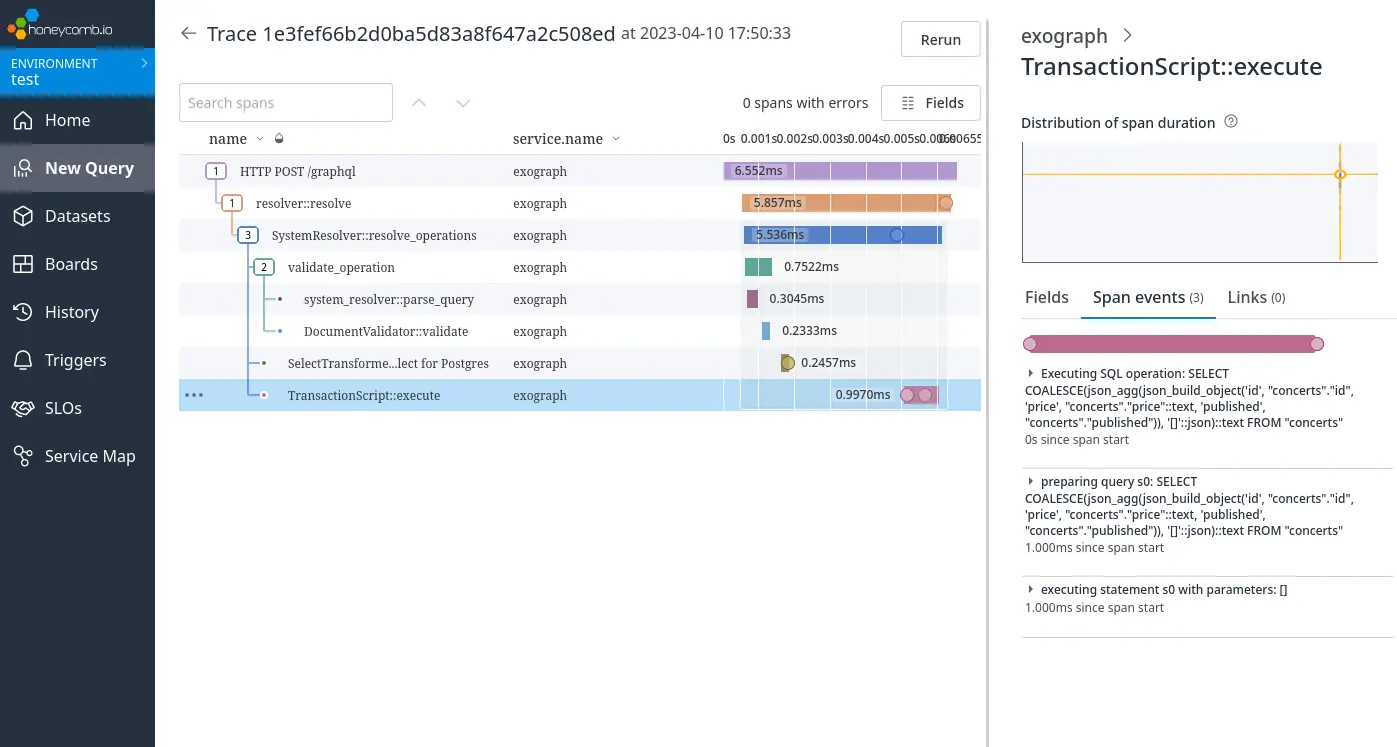
You should then see tracing output in your dashboard: